
Multicellular organisms are composed of many different cell types, each having a specialized role in the organism’s survival. In order to specialize, cells produce certain proteins with specific functions that ensure the health and well-being of the organism. Cell mapping projects, such as the NIH Common Fund Human BioMolecular Atlas Program (HuBMAP), are developing technologies that will allow researchers to map proteins to distinct cell types within tissue samples. By mapping their proteins, researchers will be able to find various cell types in the body and thus will better understand what makes a normal cell “healthy.”
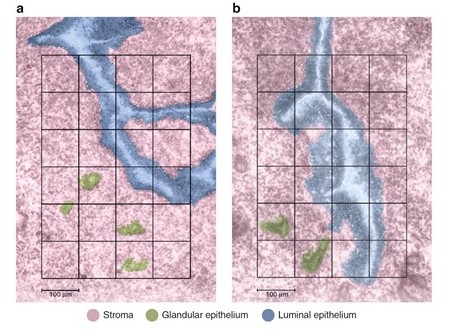
HuBMAP researcher Dr. Kristin Burnum-Johnson helped develop Nanodroplet Processing in One Pot for Trace Samples (nanoPOTS), a platform that prepares tissue samples for Matrix-Assisted Laser Desorption/Ionization imaging mass spectrometry (MALDI-IMS) (Kelly, R, et al. 2019). MALDI-IMS is used to see where particular proteins and other biomolecules are located in cells. Following this, she and colleagues at Pacific Northwest National Laboratories (PNNL) developed an automated sample collection platform combining nanoPOTS with a cell isolation technique that harvests certain types of cells. Dr. Burnum-Johnson and her team used this novel platform to map more than 2000 proteins in mouse uterine tissue during the process of preparing for embryo implantation. The researchers used uterine tissue because there are three easily distinguishable cell types in the uterine cavity. These cell types - luminal epithelial cells, stromal cells, and glandular epithelial cells – each have a unique set of proteins involved in embryo implantation and make a good test case for mapping. The combination of the automated sample collection platform with MALDI-IMS imaging allows researchers to quickly collect data about many more proteins within a particular tissue sample than ever before. Once protein data are captured, molecular maps are generated by a data visualization tool developed by PNNL, called Trelliscope (more information at - http://deltarho.org/docs-trelliscope). The resulting images show where the different cells are in relation to each other.
This cutting-edge technique will allow researchers to find the locations of proteins in cells, giving a clearer understanding of where the proteins in your cells are, and how they are keeping your cells healthy.
Video from Pacific Northwest National Laboratory about nanoPOTS here.
Tutorial for using Trelliscope to analyze and visualize large complex data in R here.
Automated mass spectrometry imaging of over 2000 proteins from tissue sections at 100-μm spatial resolution. Piehowski PD, Zhu Y, Bramer LM, Stratton KG, Zhao R, Orton DJ, Moore RJ, Yuan J, Mitchell HD, Gao Y, Webb-Robertson BM, Dey SK, Kelly RT, Burnum-Johnson KE. Nat Commun. 2020 Jan 7;11(1):8. doi: 10.1038/s41467-019-13858-z.
